Automated Email Reports
Email Performance Reports, or EPR reports, that are added directly to a schedule
Email Performance Reports
Our Automated Email Performance Reports can be added to an email schedule to analyse how recipients engage with an email campaign. The reports can be delivered by email or SFTP in a variety of formats to multiple email addresses.
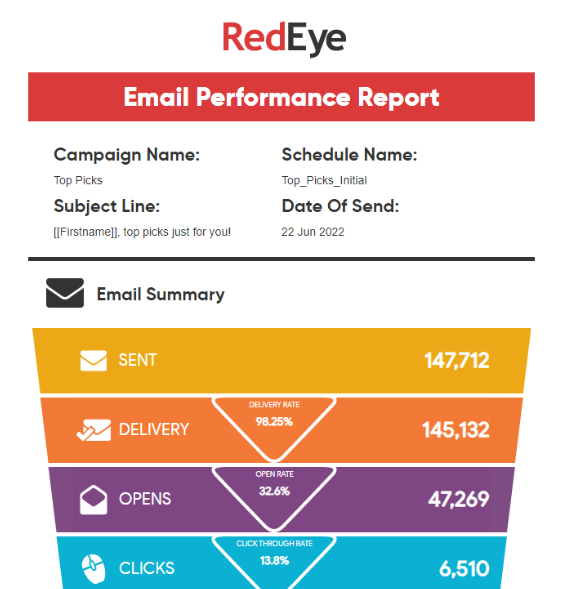
Example of an Email Performance Report
Adding a Report
These reports can be drag & dropped from the Reports toolbar item onto your email schedules:
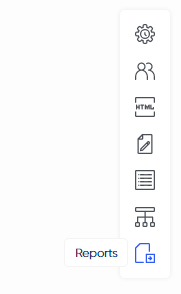
The Reports toolbar item
Recurring vs Run Once ReportsThe platform has separate reports for each campaign type, as the timeframes of the report being sent are different:
- Run Once uses day intervals after the email has been sent
- Recurring uses a day of the week you wish to receive the report for the last 30 days.
Creating a new Report
Creating a new Report is done via the Reports toolbar section, clicking "New Report":
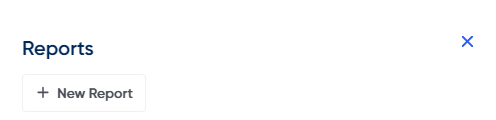
Create a new report using "New Report" under the Report toolbar section
You can then configure your report to fit your needs:
- Report Name
- The name of your report in the Reports list
- Delivery Method
- How do you want to receive this report? (Email is recommended)
- Report Format
- What format do you want to receive:
- Spreadsheet: The raw data in XLS format, split into sheets of data
- Dashboard: A visual dashboard of the results, including graphs & analysis
- Heatmap: A visual of the email itself showing where people clicked the most
- What format do you want to receive:
- Frequency
- For a Run Once report:
- At what intervals do you want to receive this report after the schedule has sent
- For a Recurring report:
- What day of the week do you want to receive you report for the last 30 days.
- For a Run Once report:
- Recipients
- Who you want this report sending to, multiple emails can be entered
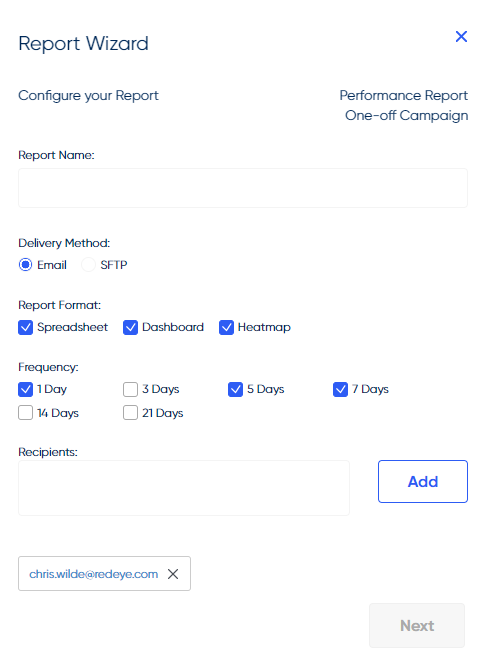
The Report Wizard for a Run Once campaign
Heatmaps are not supported for Recurring Campaigns
Viewing a Report in the platform
You can view a report for a schedule in the platform by clicking the "View Reports" icon on that schedule:
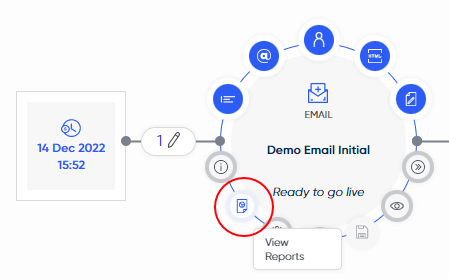
The View Reports icon is where report data can be viewed
Here you can click "View Report Data" and select the date/timeframe you wish to view, as well as the format you wish to view.
You can also compare different report timeframes against each other.
Dashboard metrics breakdown
The dashboard report contains the following types of metrics:
Email Summary
- Number of recipients the email was sent to.
- Number of recipients the email was delivered to.
- Percentage of the sent emails that were delivered successfully.
- Number of recipients that opened the email.
- Percentage of the delivered emails that were subsequently opened.
- Number of recipients that clicked on a link within the email.
- Percentage of opened emails where the recipient also clicked on a link.
- Number of recipients that purchased (last click & email influence) from the website via a link in the email.
- Percentage of recipients that clicked on a link and then purchased.
Note: These metrics are based on unique values.
Top Level Metrics
- Open Rate - percentage of the delivered emails that were subsequently opened.
- Click Through Rate - percentage of opened emails where the recipient also clicked on a link.
- Conversion Rate - percentage of delivered emails where a purchase was made via a link.
Key Responses
- Last Click - recipient remained on the website after clicking a link in the email and completed a key action (sale) in that single visit.
- Email Influence - recipient has completed a key action within a certain time frame of receiving the sent email. This is configurable however the standard measure is 28 days.
- Total - a total of both Last Click values and Email Influence values.
- Clicks - number of clicks on that link.
- Rate - percentage of that links click in relation to the over all email clicks.
Note: The key actions on the left hand side of the report are shown in the order in which they were created.
Top Links by Revenue
Shows the links that generated the most revenue. These are non unique clicks.
- Clicks - number of clicks on that link.
- Revenue - last click revenue from that link.
Segment Split
- Opens and Clicks axis - measure of non unique clicks and non unique opens for each segment.
- Segment - each segment associated with the campaign will display opens, clicks and revenue.
- Revenue Per Email axis - measures the revenue generated by each segment using last click & email influence.
Top Domains for Delivery
A breakdown of the top 5 most successful email domains that enable delivery of your email.
Top Domains for Opens
A breakdown of the top most successful email domains that generate opens of your email.
Breakdown by Device
Displays the breakdown for each device.
- Opens - non-unique number of emails opened from that device.
- Open Rate - percentage of overall opens that were opened on that device.
- Clicks - non-unique number of links clicked on that device.
- Clicks from Opens - percentage of overall opens on that device that also generate a link click.
- Revenue - revenue generated on that device using Last Click and Email Influence values.
- Revenue by Device - percentage of the overall revenue that was generated by that device.
Updated 10 months ago